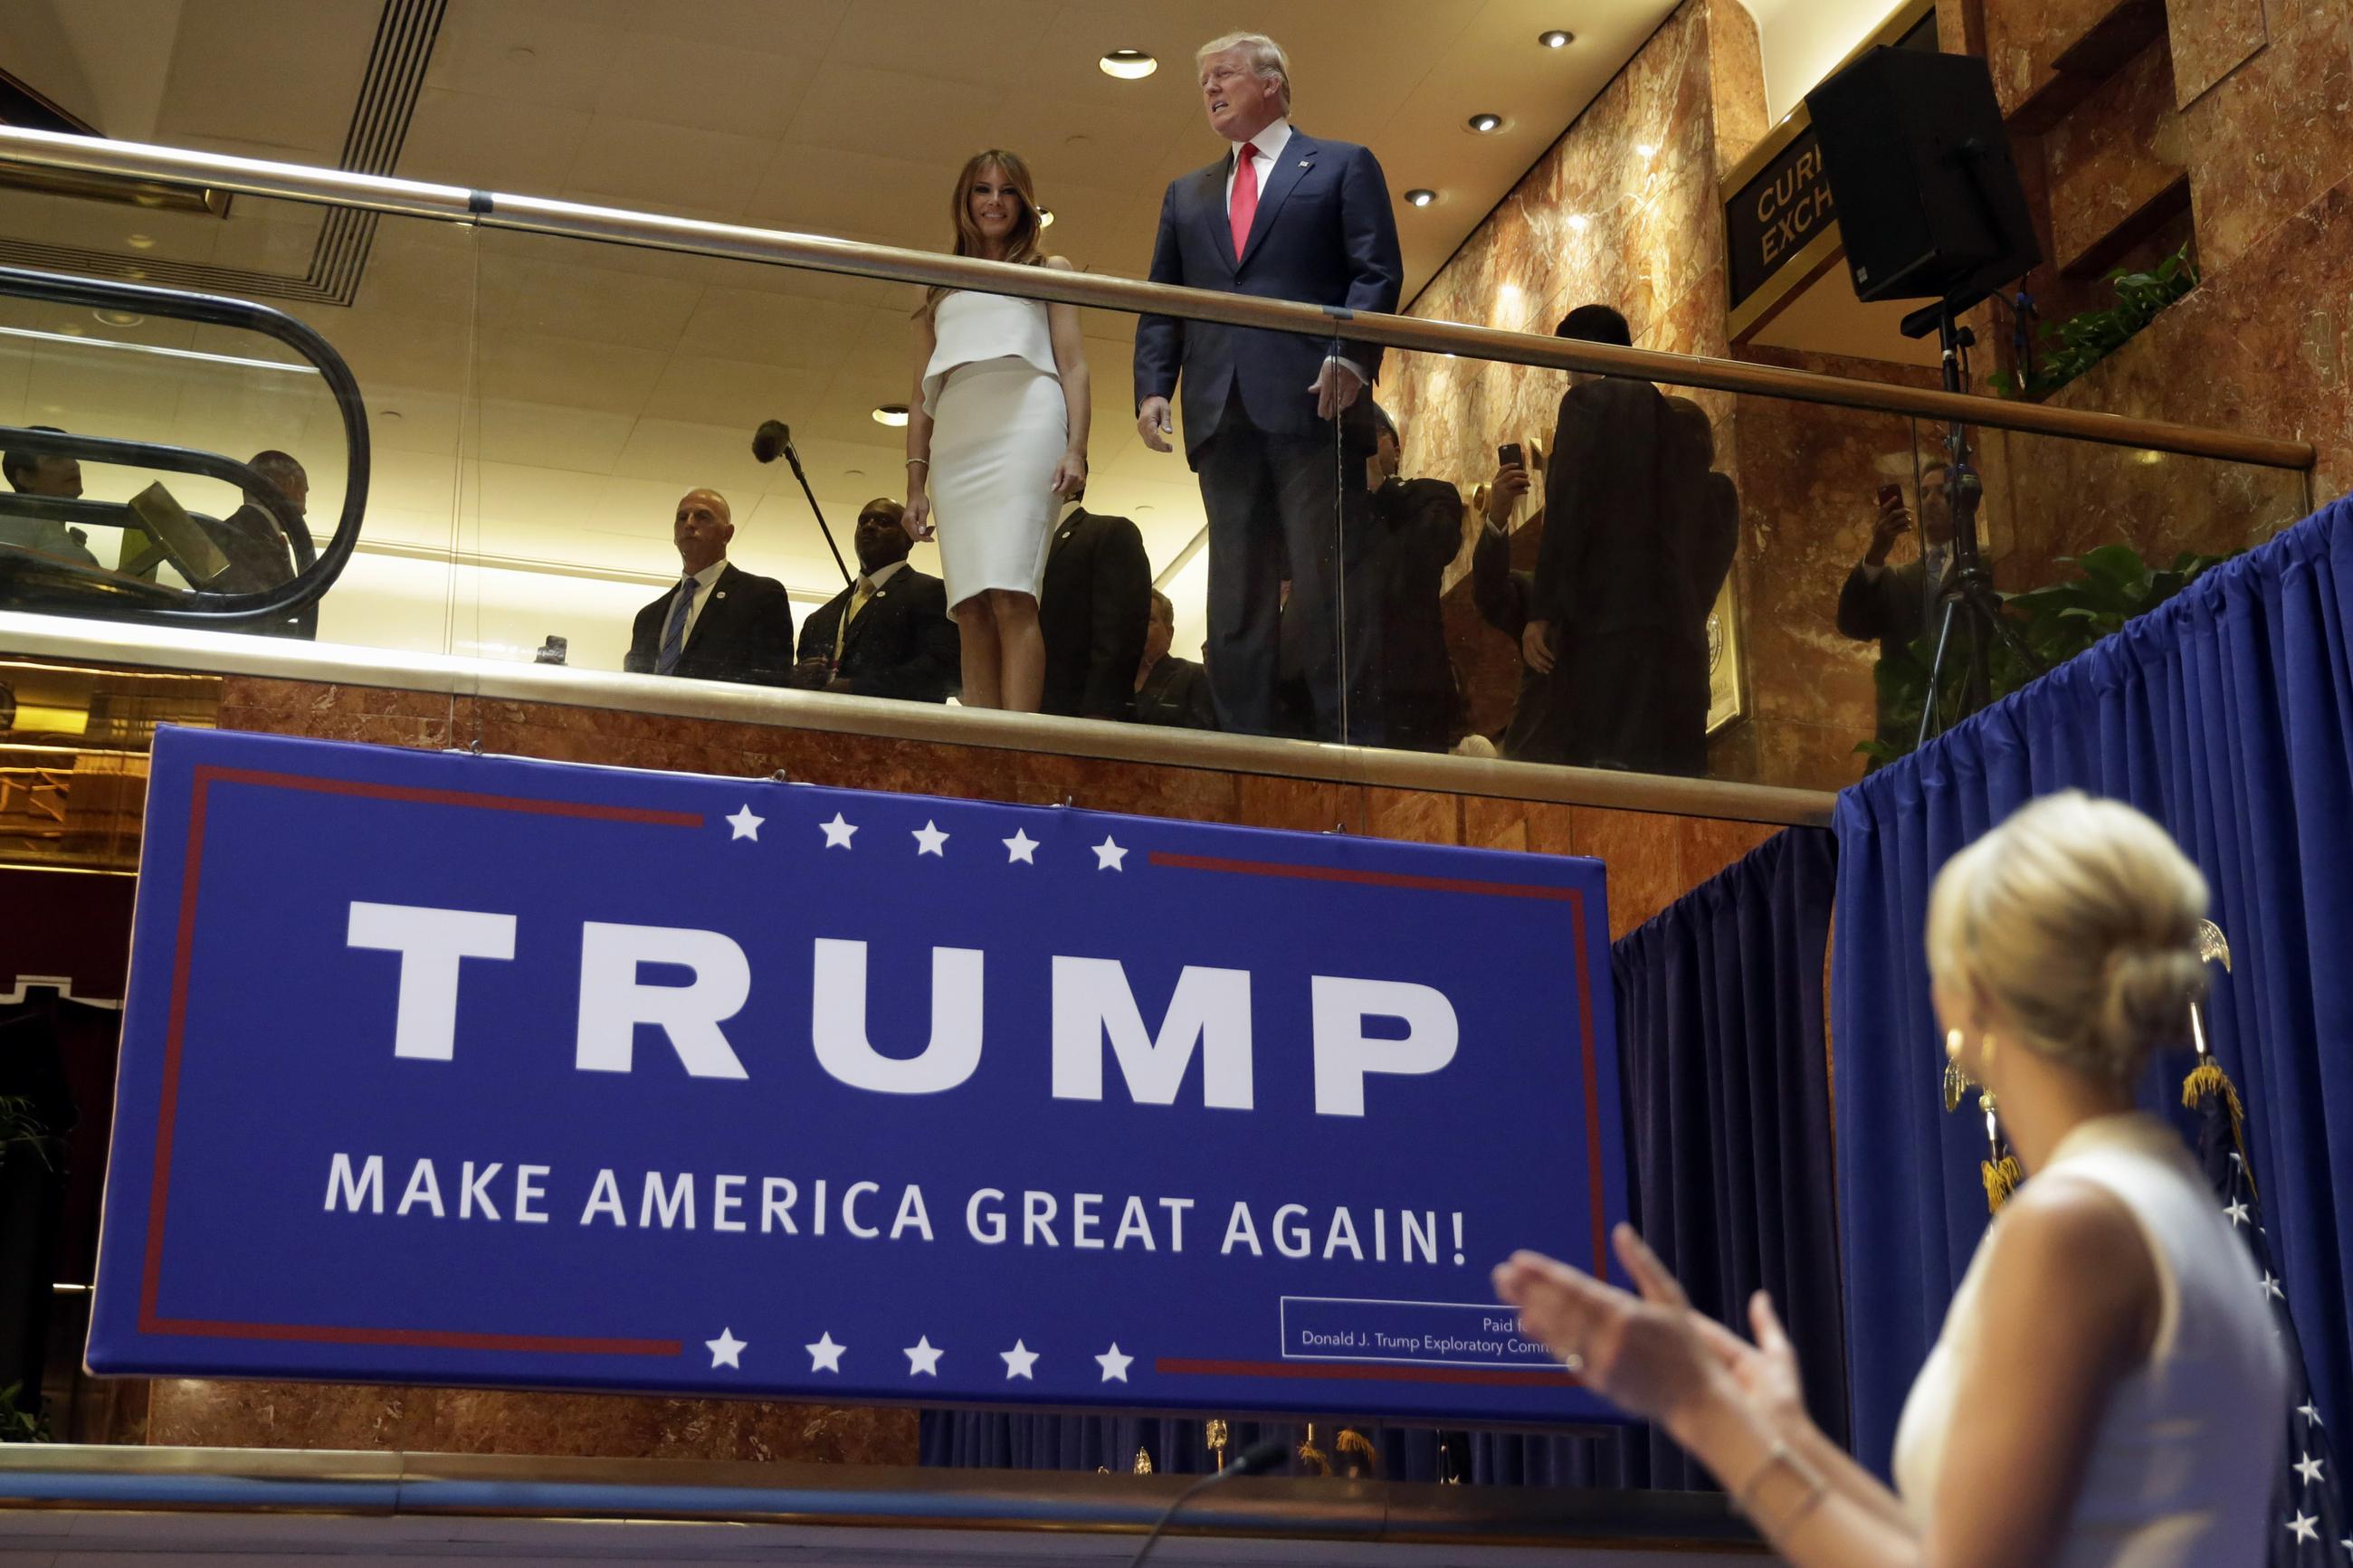
Monday marked 10 years since President Donald Trump descended the golden escalator at Trump Tower and announced his candidacy for the Republican nomination for president. Most political observers dismissed him, but by the fall of 2015, polling showed that he was becoming a formidable political presence.
None of us could have imagined the next decade. Whether you view Trump’s unorthodox (to say the least) style as good or bad, you can’t deny that he has changed the country forever.
He has also substantially changed what had been long-standing patterns in public opinion. Some of these changes were already underway—for example, partisan polarization had been rising for decades, and divides based on education level were beginning to emerge. Trump accelerated those trends while also transforming the Republican Party.
As a result, how we interpret public opinion has changed as well. The baseline for what is “good” or “bad” for a president is different than it was 10 years ago. Trump’s approval rating didn’t rise above 50 percent in his first term except briefly at the very beginning, and it didn’t drop below 35 percent no matter what he did. The same pattern is playing out so far in his second term. (This effect may not be isolated to Trump: President Joe Biden’s approval ratings followed the same pattern, just with the opposite partisan composition.)
The contrast with prior presidents’ ratings is stark. Barack Obama started with nearly 70 percent approval and left office at 58 percent, although for much of his term, his approval stayed in the 40-50 percent range. George W. Bush’s approval ratings were as high as 90 percent in the aftermath of 9/11 and as low as 25 percent during the September 2008 market crash. Bill Clinton had a low of 37 percent approval and a high of 73 percent, staying in positive territory for most of his two terms. I could keep going, but the point is that every president prior to Trump had higher highs and lower lows in their approval ratings than Trump or Biden.
Opinion on policies often follows a similar track these days, too. Polls asking about a particular issue often show 50-something percent support and 40-something percent opposition, with both numbers lower if respondents are allowed to say they don’t know. It’s always partisan—either Democrats overwhelmingly support and Republicans overwhelmingly oppose, or vice versa, with independents usually splitting 60-40 in one direction or another.
The interpretations I find interesting are those that declare an issue “good” or “bad” for Trump without a majority on either side. A prime example is polling on Trump sending Marines to Los Angeles last week: A Washington Post-Schar School poll showed that 41 percent of Americans support the move, 44 percent oppose it, and the rest are unsure. A YouGov poll showed 34 percent support and 47 percent oppose, with the rest unsure.
Some analysts were quick to say the deployment of Marines was a losing issue for Trump based on these polls simply because more opposed than supported it. But note that the reference point for a winning or losing issue isn’t even 50 percent at this point—it’s a plurality. My alternate reading of these numbers is that we can’t even get a majority to oppose an act that was traditionally viewed as pretty extreme – sending the Marines to deal with a domestic matter.
Plus, as political analyst Amy Walter noted on X, a large contingent of the country, at least 40 percent, will disapprove of anything Trump does simply because it’s Trump. That 40-something percent threshold is actually a fairly low bar, especially if you consider Trump’s electoral history.
Trump got 49.8 percent of the vote in 2024, which means 50.2 opposed him. But that baseline of 50 percent opposition is among only those who voted, and issue polls measure all adults or registered voters. Among those larger groups, Trump’s baseline opposition is probably more like 45-47 percent.
The bigger picture is that we are now analyzing public opinion through a lens that interprets what used to be considered pretty small differences—pluralities and narrow majorities – as wins and losses. The last 10 years have retrained how most of us look at public opinion data, and I’m not sure that’s a good thing. It inevitably leaves 45 percent of the country unhappy.
Contributing editor Natalie Jackson is a vice president at GQR Research.