National Journal Logo

FILTER

Clear Filters »

BY DATE

Clear Filters »

BY TOPIC

  • Infographics (40)
  • Economy and Finance (11)
  • Congress (5)
  • The Cook Political Report (3)
  • The Cook Political Report with Amy Walter (3)
  • Elections (3)
  • Government shutdown (3)
  • Presentation Center Premium: Tax/Labor/Economics (2)
  • Health Care (2)
  • Lobbying (2)
Infographics x Clear Filters »

RESULTS

SORT BY DATE
SORT BY RELEVANCE
INFOGRAPHICS

Changes in U.S. the consumer price index

INFOGRAPHICS

Perceived changes in everyday costs

INFOGRAPHICS

Top 5 lobbying firms in 2024

INFOGRAPHICS

Average gas prices, by state

INFOGRAPHICS

Corporate 2024 H-1B visa allocation

INFOGRAPHICS

10 SCOTUS cases to watch

INFOGRAPHICS

GDP growth during government shutdowns

INFOGRAPHICS

Government shutdowns: contextualized

INFOGRAPHICS

September 2025 stock market performance

INFOGRAPHICS

Board of Governors one-pager

INFOGRAPHICS

September FOMC one-pager

INFOGRAPHICS

Global AI ranking table

INFOGRAPHICS

Global AI capacity visual

Showing results 1 through 20 out of 234
Next
×
×

Welcome to National Journal!

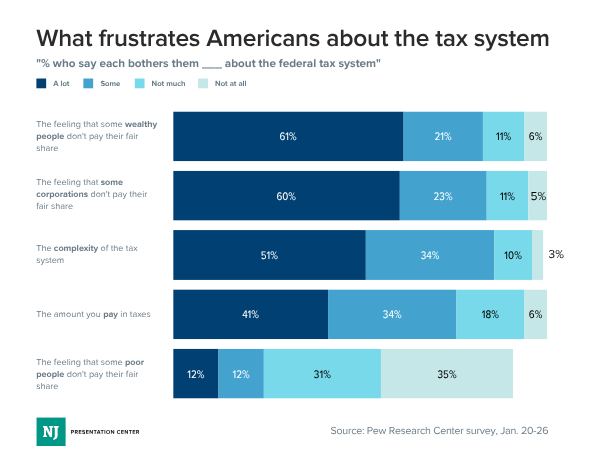
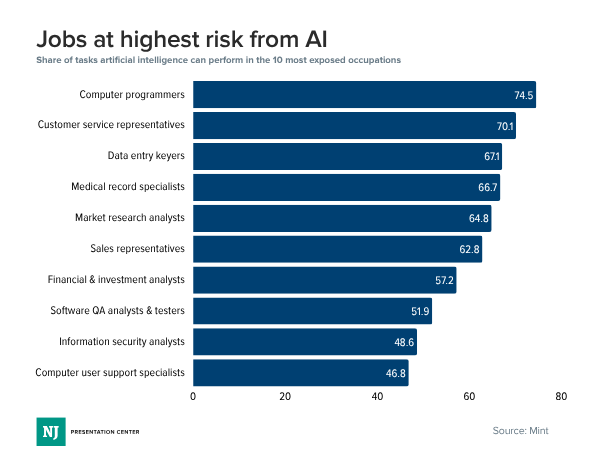
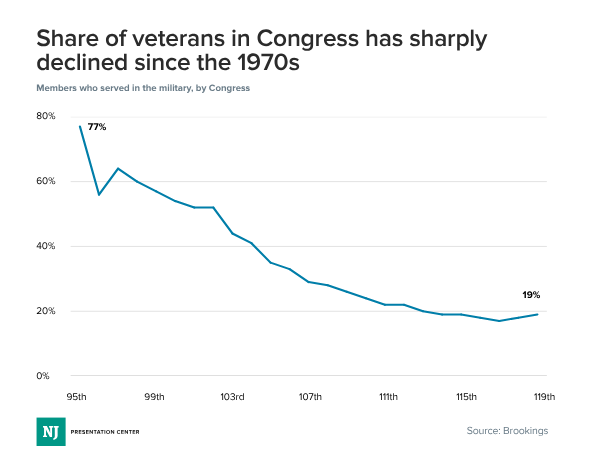
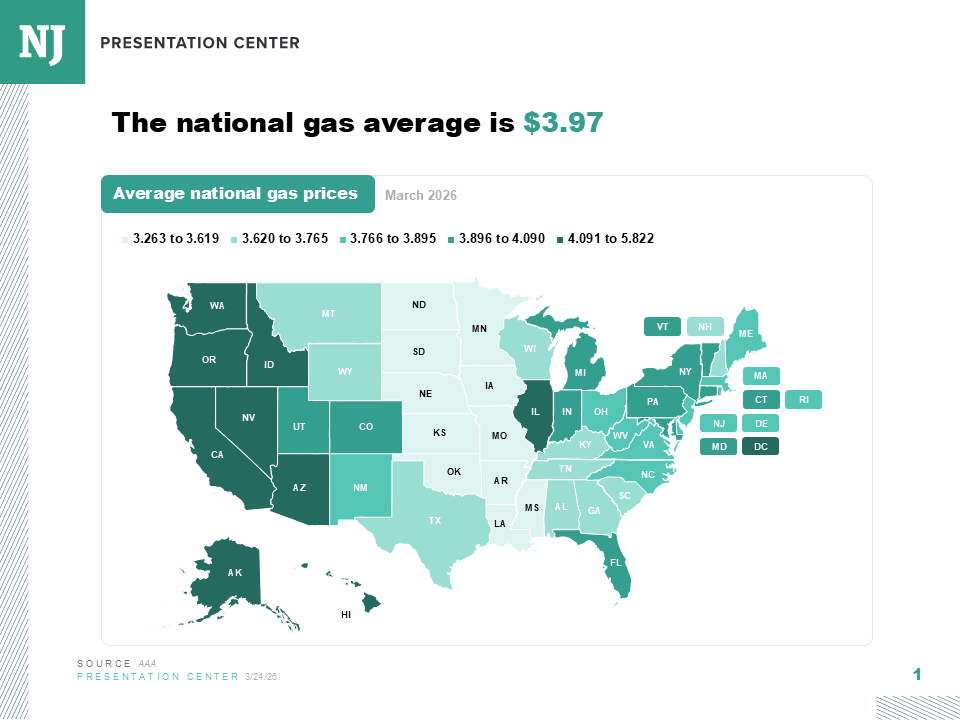
You are currently accessing National Journal from IP access. Please login to access this feature. If you have any questions, please contact your Dedicated Advisor.

Login